Every month, as soon as NAAMSA’s figures are released, it’s a scramble to see who’s in the lead.
This month was a bit of an anomaly, as the Ford Ranger lost its usual second place to the Nissan NP200, much to the chagrin of Hilux loyalists.
It’s not as clear-cut as that, however. While Toyota usually leads in terms of the number of units sold, the Ranger tends to be leader as far as the double cab market is concerned.
To get a clearer understanding of bakkie sales in South Africa, we asked the kind folks at Lightstone Auto to give us a model-specific breakdown of sales.
Unfortunately, the final figures for August will only be confirmed next week, but we do have figures for the first seven months of 2018, providing a clear answer as to who is in the lead when it comes to selling leisure double cabs…
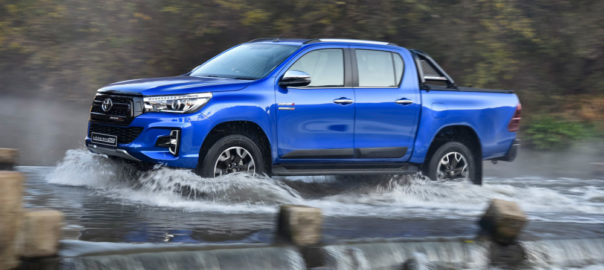
The Ford Ranger is the winner, but the margin is not as big as you might think. From January 2019 to July 2019 Ford sold a grand total of 10 642 double cabs, 2 453 extra cabs and 1 906 single cabs.
The Toyota Hilux managed 10 548 double cabs, 5 102 extra cabs and 8 230 single cabs.
That’s a total of 15 001 Ford Rangers sold between January 2019 and July 2019, versus a total of 23 914 Hilux models. (The extra 34 on the Hilux side comes courtesy of chassis cab sales.)
That means over that period, Ford sold 94 more double cabs than Toyota. Over that same period Toyota sold 2 649 more extra cabs than Ford and 6 324 single cabs more than Ford.
Down below you’ll find a clear breakdown of every month, but here are a few anomalies worth looking out for.
The Ford Ranger dominates the double cab market, more often than not. But Toyota sold more double cabs in March (2055 versus 1369), May (1379 versus 1311) and June (1885 versus 1622.) Oddly, Toyota only managed to sell 802 Hilux double cabs in April, which is the only month that figure dips below four figures.
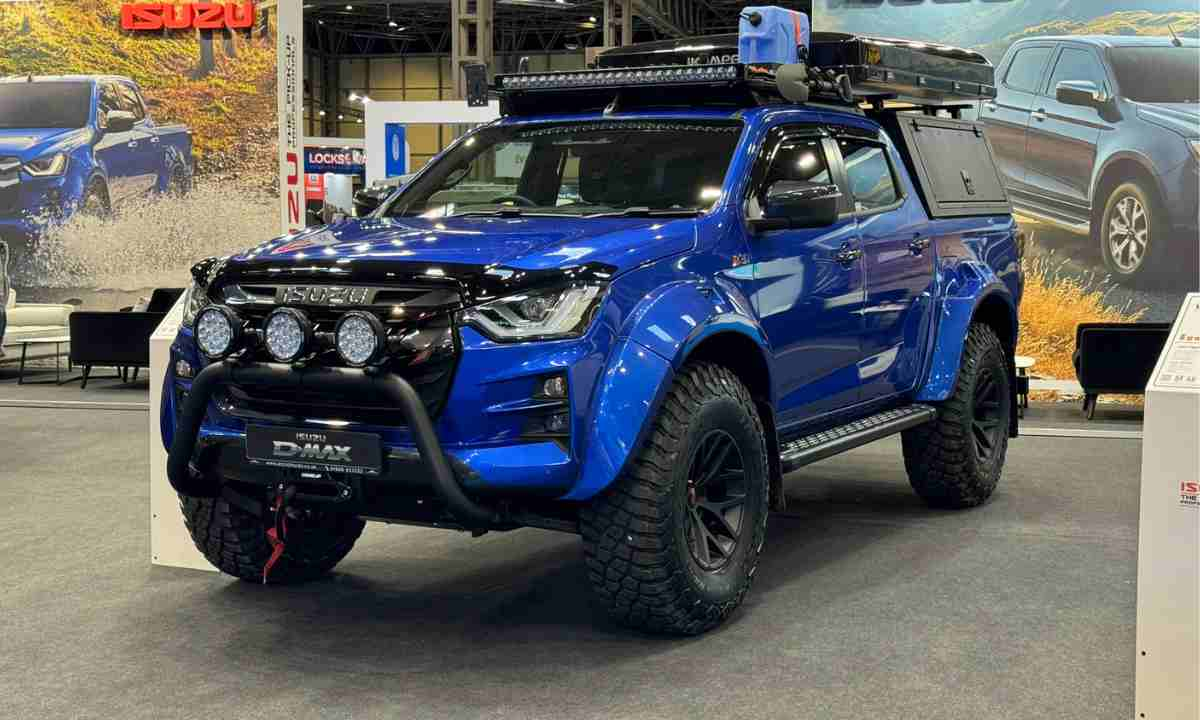
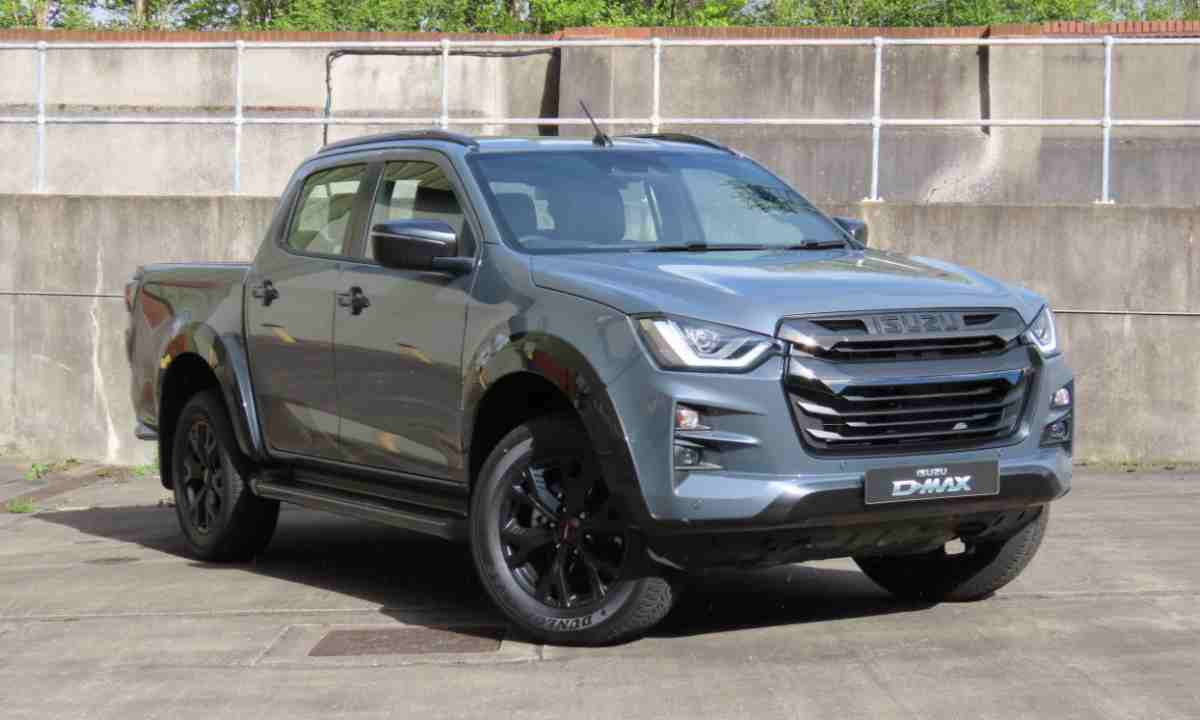
As a matter of interest, we also asked for figures for the Isuzu D-Max and Mahindra Scorpio.
The Isuzu D-Max’s final tally stood at 3 878 double cabs, 728 extended cabs and 5026 single cabs, which is more than Ford’s 1906.
The figures also show that the Mahindra Pik Up single cab is more successful than the double cab. After the first seven months of 2019, the Pik Up’s single cab figure stood at 1326, while the double cab figure came in at 355. These figures aren’t close to what the big three are posting, but Mahindra’s single cab figure is uncomfortably close to Ford’s single cab figure.
As requested by a reader, we also acquired the total sales figure for the VW Amarok, which is only available as a double cab. At the end of July, total Amarok sales stood at 1673 units.
Here’s the full breakdown of sales, in case you want a closer look.
| Type | Jan-19 | Feb-19 | Mar-19 | Apr-19 | May-19 | Jun-19 | Jul-19 | Jan-Jul | |||||
| FORD Ranger D-Cab | 1 535 | 1 847 | 1 369 | 1 223 | 1 311 | 1 622 | 1 735 | 10 642 | |||||
| FORD Ranger X-Cab | 387 | 431 | 624 | 224 | 294 | 204 | 289 | 2 453 | |||||
| FORD Ranger S-Cab | 271 | 300 | 383 | 188 | 368 | 203 | 193 | 1 906 | |||||
| ISUZU D-MAX & KB S-Cab | 533 | 636 | 798 | 631 | 688 | 836 | 904 | 5 026 | |||||
| ISUZU D-MAX & KB D-Cab | 447 | 430 | 662 | 505 | 506 | 653 | 673 | 3 876 | |||||
| ISUZU D-MAX & KB X-Cab | 94 | 107 | 102 | 101 | 103 | 107 | 114 | 728 | |||||
| ISUZU D-MAX & KB C-Cab | 18 | 13 | 45 | 5 | 15 | 15 | 32 | 143 | |||||
| MAHINDRA Scorpio Pik-Up S-Cab | 204 | 158 | 209 | 160 | 171 | 192 | 232 | 1 326 | |||||
| MAHINDRA Scorpio Pik-Up D-Cab | 60 | 67 | 43 | 46 | 41 | 46 | 52 | 355 | |||||
| MAHINDRA Scorpio Pik-Up C-Cab | 2 | 1 | 1 | 2 | 3 | 3 | 2 | 14 | |||||
| TOYOTA Hilux D-Cab | 1244 | 1672 | 2055 | 802 | 1379 | 1885 | 1 511 | 10 548 | |||||
| TOYOTA Hilux S-Cab | 1020 | 1255 | 1519 | 1155 | 980 | 1237 | 1064 | 8 230 | |||||
| TOYOTA Hilux X-Cab | 524 | 564 | 671 | 451 | 826 | 1648 | 418 | 5 102 | |||||
| TOYOTA Hilux C-Cab | 6 | 13 | 7 | 3 | 2 | 0 | 3 | 34 | |||||