
(We’ll be updating this article daily as we count down from 10 to 1. The methodology can be found in the full-length article below, along with all the downloadable data, but if you’re looking for a quick link to a specific bakkie, check out the list below.)
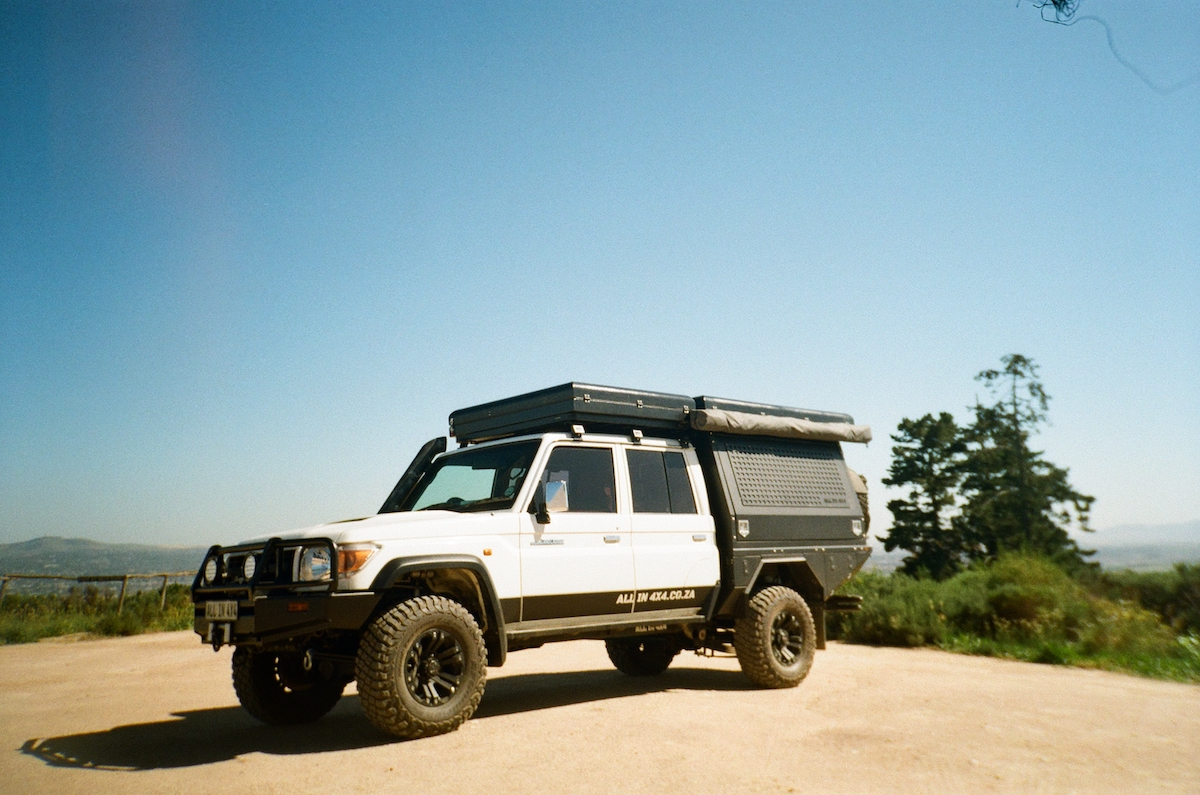
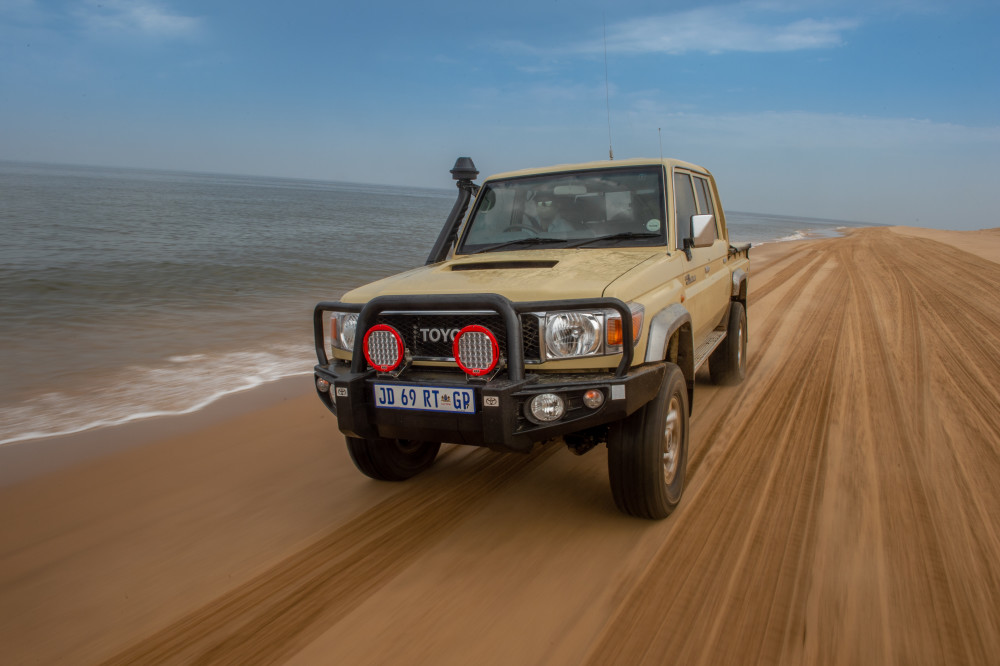
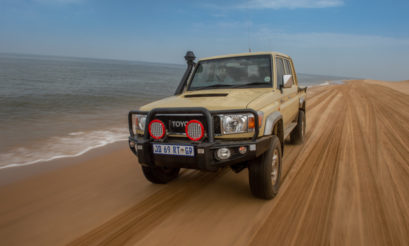
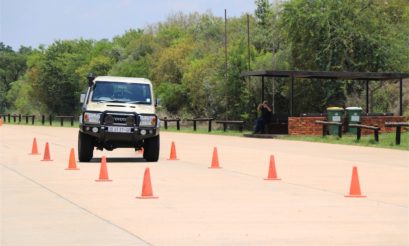
10th Place: TOYOTA LAND CRUISER 79 4.5D-4D NAMIB
9th Place: MAHINDRA PIK UP 2.2CRDE 4×4 S10 KAROO
8TH PLACE: MITSUBISHI TRITON 2.4DI-D 4×4 AT
7TH PLACE: NISSAN NAVARA 2.3D 4×4 STEALTH AT
6TH PLACE: ISUZU D-MAX 3.0TD 4×4 LX
5TH PLACE: MERCEDES-BENZ X350D 4MATIC
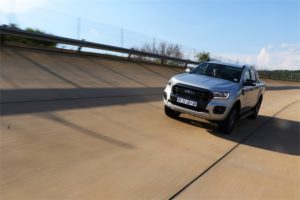
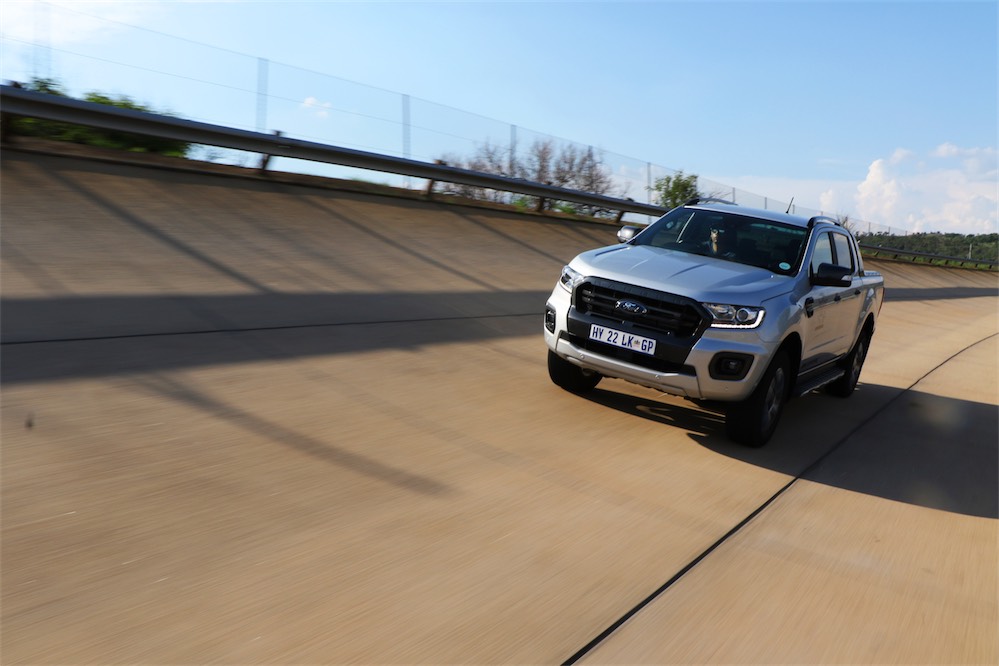
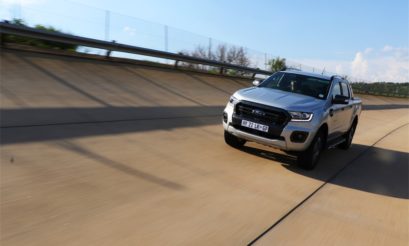
4TH PLACE: FORD RANGER 2.0 BI-TURBO 4×4 WILDTRAK
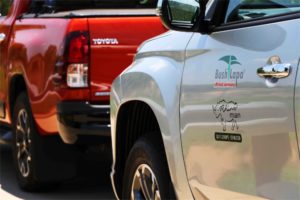
3RD PLACE: TOYOTA HILUX 2.8GD-6 LEGEND 50 4×4
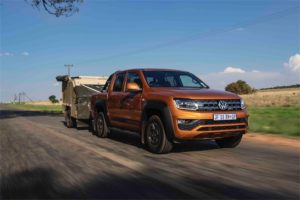
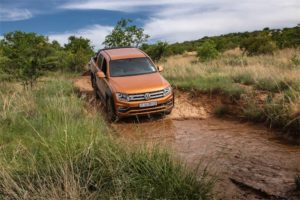
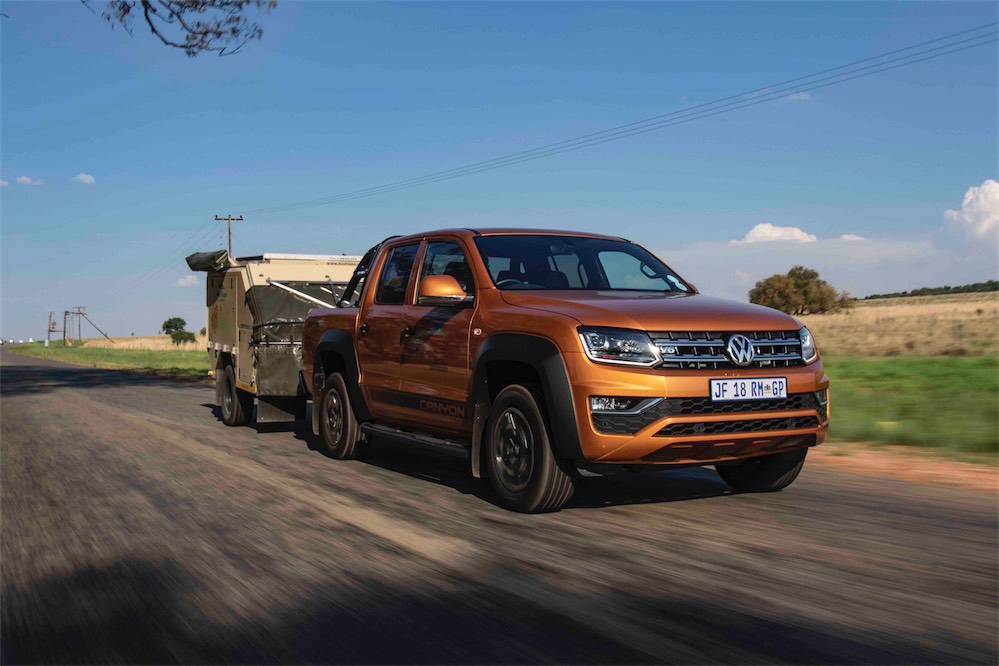
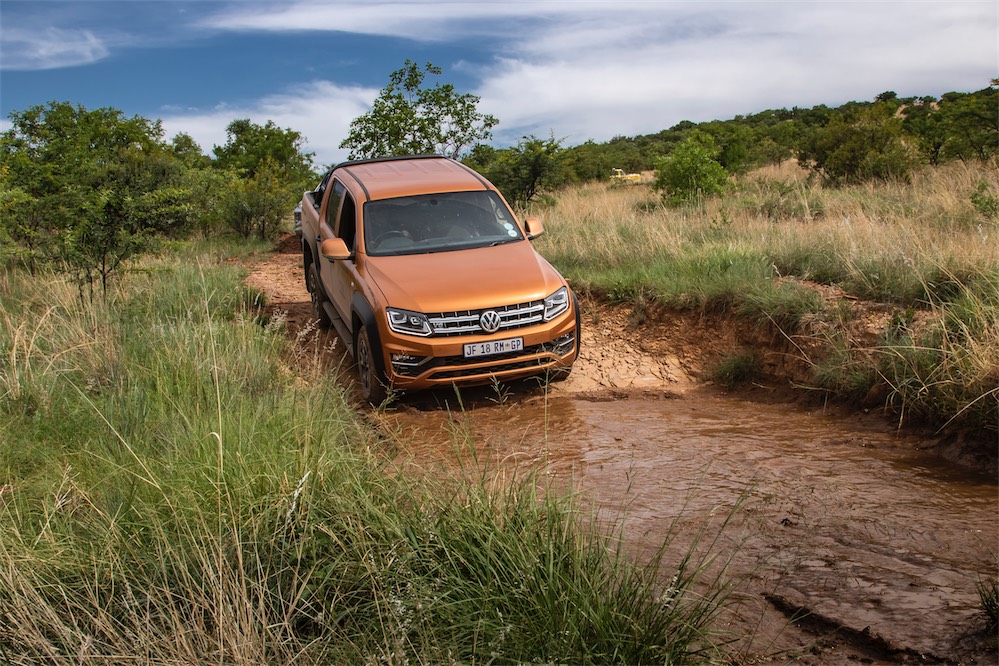
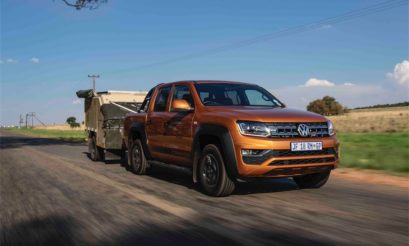
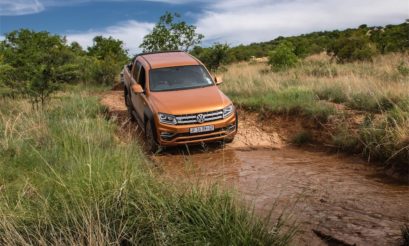
WINNER: VW AMAROK 3.0TDI V6 4MOTION CANYON
Forget Eskom and load shedding. Never mind the Guptas. No matter the latest South African Airways cash shortfall. Bosasa? Bosasa what?
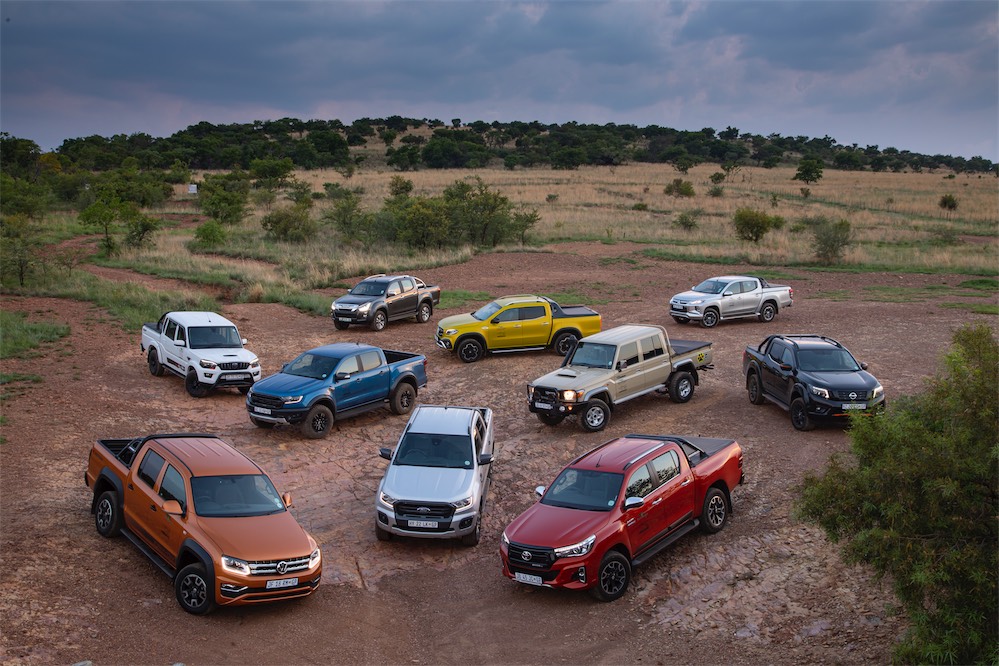
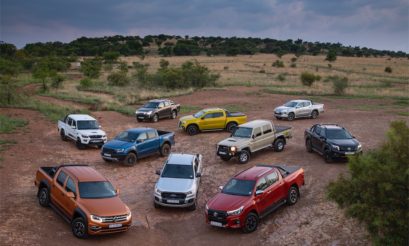
Police generals, that don’t know left from right? Whatever. The hottest topic around most South African braais really is ‘which bakkie is better.’ Enter our inaugural Bakkie of the Year competition: a bespoke new format that adds some measurable factors and data to that debate.
Just over 27 metres. That’s nearly the length of a basketball court.
It’s also the difference in braking distance from 100km/h to standstill between two bakkies, with a 500kg load on the ‘bak.’ A crucial bit of information, you’d agree, if safety is at the sharper end of your wishlist for a new bakkie.
Part of the most extensive group test we’ve ever devised, and part of our inaugural Bakkie of the Year competition, the braking test is one of a host of new independent assessments to help determine which bakkie really is best.
We went more pragmatic than ever before, deciding to skip formerly populist criteria such as 0–100km/h acceleration times, top speeds, and so on. Instead, we focused on areas that make a real difference in real people’s lives. Like real-world fuel consumption, load-carrying ability, handling, 4×4 ability, safety, towing, the interior elements, and long-term ownership.
There were a lot of surprises.
Like that braking distance, mentioned above. An eye- watering R140 000 difference between a typical parts bin of two bakkies, on either end of the affordability scale. The legal load capacity when the gross vehicle mass (GVM) of the respective vehicles is added to the equation. And many more.
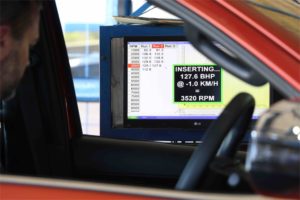
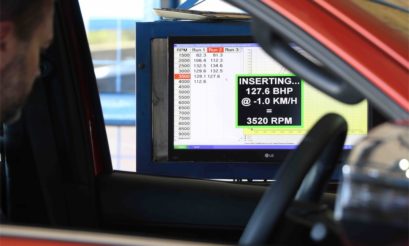
In the end, 80% of the scores in this test were achieved in the following ways: repeatable dynamic tests at the Gerotek Vehicle Testing grounds near Pretoria, using an independent company; the acquisition and assimilation of data, in respective segments; and partnerships with industry leaders to help identify possible long-term ownership pitfalls.
But we also realise buying a bakkie is, for most of us, not only about data and numbers, it’s also an emotive process. It’s a seat of the pants thing and no numbers can replicate the actual experience of driving a vehicle, feeling it respond to your inputs, or not.
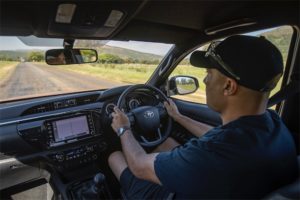
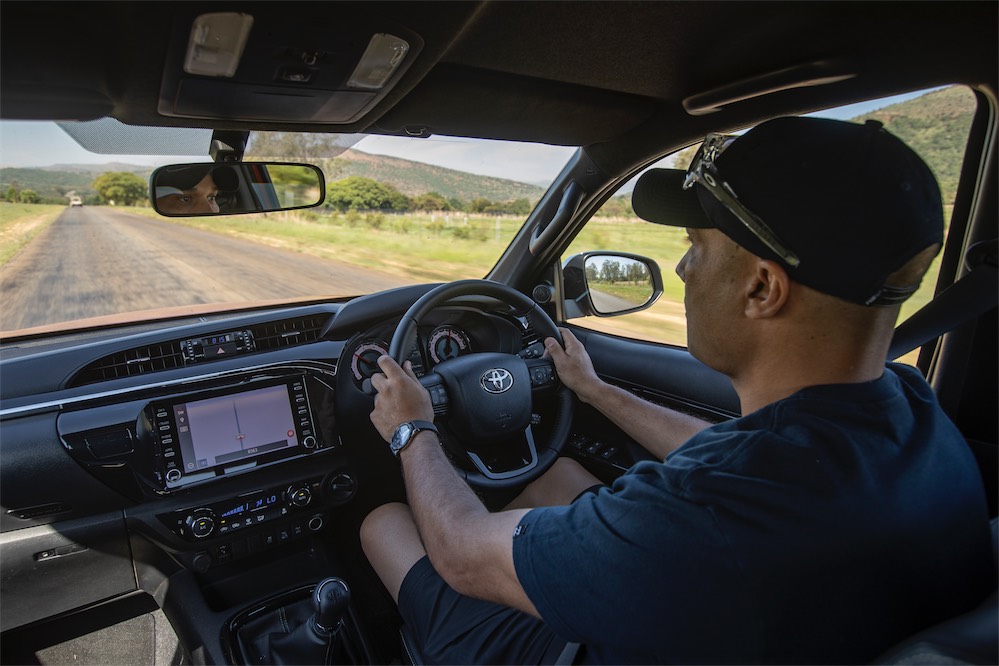
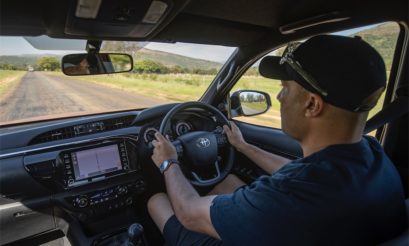
For this reason, we asked a small panel of expert judges, ranging from advanced driving instructors to 4×4 experts to one of South Africa’s most decorated motoring journalists, to drive all 10 bakkies. They did this on the same day, over the same route, in the same conditions. Finally, scores were allocated.
This subjective part of the test accounts for 20% of the overall score.
With all that said, we certainly don’t claim this test to be the alpha and omega of all bakkie tests and assessments. It’s not perfect in every way but it’s definitely the most comprehensive test of its kind in South Africa. It will also serve as a valuable tool for any prospective bakkie buyer who has not yet made that final decision.
Let’s get down to business then, and the criteria we used. Here’s a brief explanation of each segment, in no particular order.
FUEL CONSUMPTION
It’s no surprise that the official fuel consumption figures claimed by most car companies are virtually impossible to replicate in real-world conditions.
This is not necessarily because the car companies want to pull the wool over consumers’ eyes, but rather the result of internationally recognised and standardised tests conducted in laboratory conditions. A vehicle is strapped onto rollers in regulated climatic conditions and the engine
is run in absolutely ideal, constant conditions, and consumption measured.
These results are actual
results as achieved by a specific vehicle, they just have very little relevance in the real world, where we have to deal with traffic, loads, high-speed overtaking, and so on.
A typical fuel economy event, we believe, is not representative of a real-world, Average Joe scenario.
So we created a repeatable test at Gerotek to simulate a typical day in a double cab bakkie’s life: from a 190kg load on the bak, to stop-and-go scenarios, to in-gear overtaking, to several high speed runs.
The results of this test are what owners of these bakkies can realistically expect to achieve between refuels.
SAFETY
For some prospective bakkie owners, safety is a paramount factor. And with new safety technology such as autonomous braking, radar systems, lane departure warning and the like becoming more common in passenger cars, the bakkie segment’s perceived lack of inherent safety systems has become a hot topic.
For this segment, we combined a few factors. For starters, we listed all the standard safety features of each bakkie. But all the latest safety systems won’t mean anything if your bakkie can’t stop properly, so we combined each bakkie’s 100–0km/h stopping time with the standard features, for a more comprehensive overall safety performance. This segment’s results were an eye-opener, to say the least.
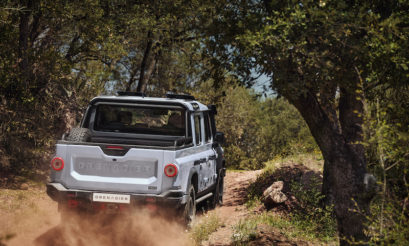
4×4 ABILITY
Several criteria were combined in this segment. This included actual ground clearance (as measured and not a claimed manufacturer number), actual approach angles (again measured), turning circle, standard 4×4 kit and hardware, and the driving experience on ADA’s 4×4 track.
Interestingly, a couple of the regular frontrunners fell by the wayside in this department while some stalwarts really arrived at the party, thriving in the tough conditions.
INTERIOR
The cabin is obviously the most familiar point of contact for a vehicle’s owner. It’s an important space. A space that needs to be practical yet modern, functional yet stylish.
Here, again, we did some legwork and researched all the standard equipment in each cabin. Connectivity plays an increasingly important role in modern motoring, so infotainment systems with Apple CarPlay and Android Auto are more desirable than those without.
Another vital part of the cabin is rear legroom. Front occupants never have an issue in double cabs, but rear-seat occupants are often less fortunate. So we had the same driver select a suitable driving position, then measured actual rear legroom. Lastly, there is perceived quality. The cabin of a vehicle may be as good looking and modern as you could wish for but if the plastics used in the design and cheap and nasty, and the dials feel flimsy, it ruins the overall picture. So we added perceived quality to the equation, with the same criteria applied to all the bakkies.
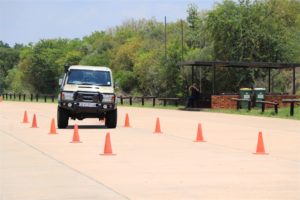
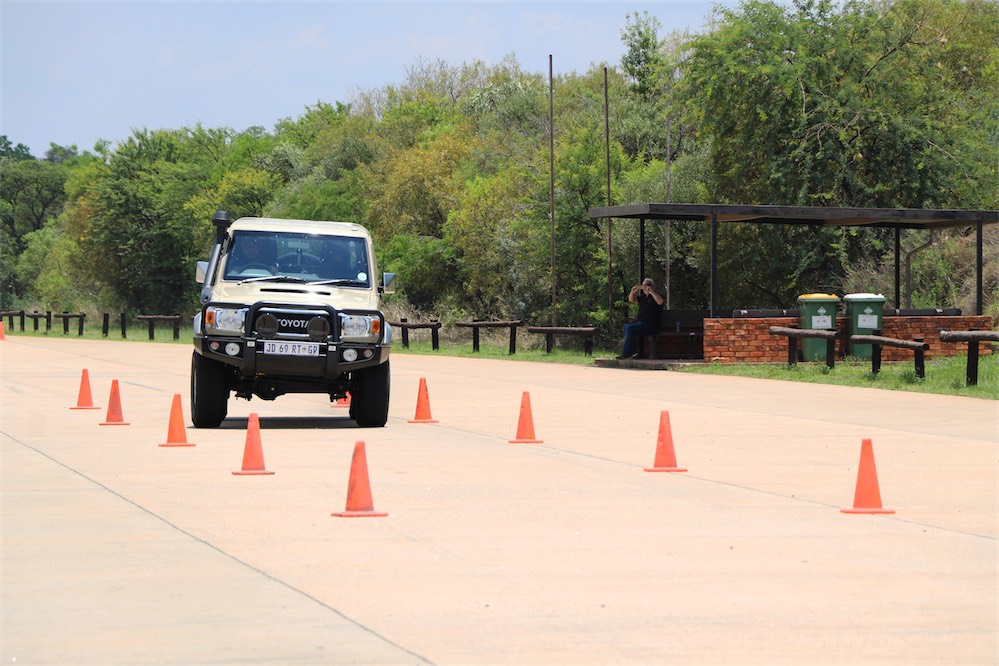
HANDLING
Ah, a controversial department, for sure. Some Ford Ranger fanatics constantly remind anyone within earshot about the so-called Moose test conducted by Swedish motoring publication Teknikens Varld. In that 2016 test, the Hilux was subjected to a version of the ISO handling test and appeared to fail miserably, nearly rolling.
We don’t know all the factors that influenced the test, like tyre pressures, distances between the cones (which can have a marked affect), and so forth. We’ve also realised you can’t believe everything you see on YouTube. So we subjected all the bakkies to the internationally recognised ISO 3888-1 double lane-change test, with the legendary Jakes Jacobs behind the wheel.
Jacobs’ company National Automotive Laboratory specialises in these sorts of tests and you’d be hard- pressed to find a more skilled driver than Jakes to conduct repeatable, consistent tests, pushing a vehicle to its absolute maximum levels of grip.
And no, the Toyota Hilux did not roll. Nor did any other bakkie. However, some of the more fancied bakkies didn’t quite live up to expectations, while some of the underrated vehicles impressed Jakes no end.
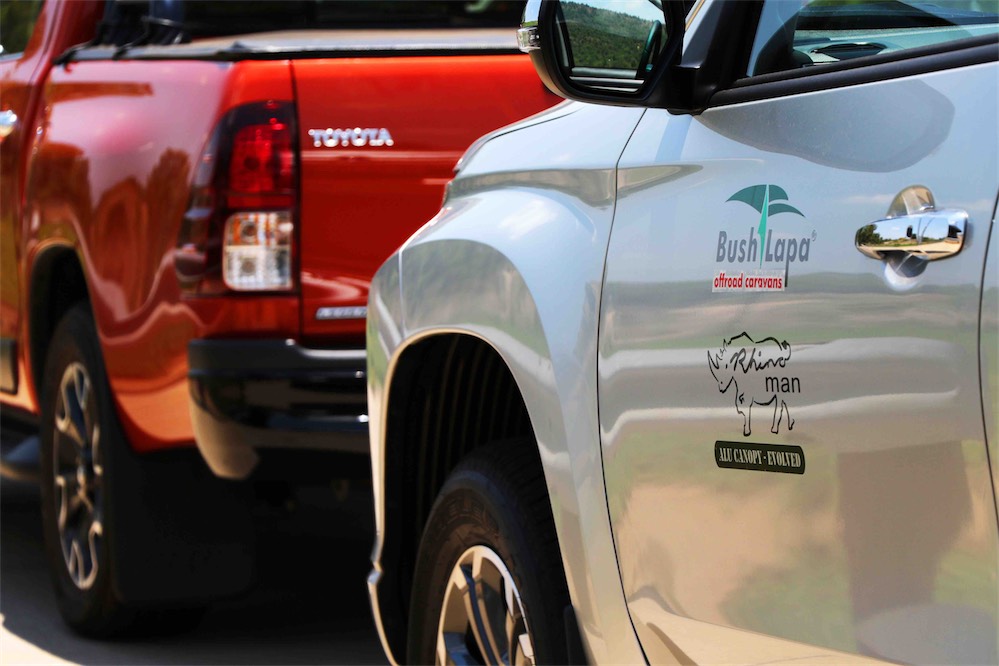
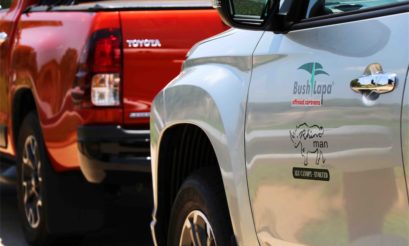
TOWING
Initially, we had an ambitious plan for this segment. Or foolhardy plan, more likely. The plan was to tow a loaded Bush Lapa Miskruier caravan, tipping the scale at around 1.4 tons, through the standard ISO 3888-1 handling test, achieving a measurable speed.
But even Jakes Jacobs, as brave and as skilled as he is, pondered the wisdom of such a test. “I can have a go,” he started. “But the chances of that lovely Bush Lapa caravan landing on its roof is, well… it’s pretty much certain that will eventually happen, as the test requires the vehicle to achieve the emergency lane change as fast as possible. So we’ll be pushing to the absolute limits, and when you are in that zone… things can go wrong quickly.”
After that statement, the near-certain destruction of the caravan did not appear to be a sound plan, so we came up with a plan B: Jakes, who has been caravanning most of his life, would take each bakkie, with the Bush Lapa van in tow, over the same route, in the same conditions. Then he would rate them according to in-gear acceleration, braking, direction stability, suspension: ride and comfort, and driveability: gear selection and ratios. The Bush Lapa caravan remained intact, and independent tester Jakes Jacobs sorted the scores.
WEIGHT-CARRYING ABILITY
In our view, this is a vital part of the test. After all, these are bakkies, with a bak – they are supposed to carry something on that bak at some stage.
Firstly, we weighed each bakkie on Gerotek’s scale (with a full fuel tank and the same driver). A simple calculation followed: subtracting this measured weight from the gross vehicle mass (GVM), as stated on the licence disc. This number equates to the actual payload the bakkie can carry, by law (even though its drivetrain can properly handle much more). We also added 500kg worth of sandbags to each vehicle, and measured the sagging at the end of the rear bumper. Additionally, we measured braking distances with the 500kg added. And finally, we measured the acceleration from 80–120km/h of each vehicle, with that 500kg load. The final results were a turn-up for the books.
JUDGES’ CALL
Our five judges drove each bakkie over a distance of 45km, in the vicinity of Hartbeespoort Dam. The route included fast tar roads, slow, bumpy and winding gravel tracks, as well as some faster, smoother dirt sections.
Essentially though, each judge got to drive each bakkie over exactly the same route, an ideal base for comparing apples with apples. As always, the scoring reflected different preferences… one judge would love the handling of bakkie A on a gravel road, while another judge may think the same bakkie is the worst-handling vehicle on gravel they have ever driven.
As the French so eloquently states: vive la difference. In the end, it comes down to different strokes for different folks. Our judges, who were not privy to any of the test data gathered at the Gerotek vehicle testing grounds, were asked to judge these vehicles simply from the, well, the seat of their pants… like Average Joe would. The result was an unencumbered driving impression of each vehicle.
LONGER-TERM OWNERSHIP
Resale values of respective brands, for a three-year-old vehicle came into play here.
Everything doesn’t always go according to plan, so we asked consumer journalist Malcolm Kinsey to compile one of his specialist parts bin reports for each and every model in this line-up. The results of this parts bin exercise were quite the surprise.
We teamed up with popular motoring website Cars.co.za as the brand’s annual Consumer Awards are considered to be a new benchmark in the automotive sector, providing most relevant consumer advice. Cars.co.za supplied its comprehensive brand research. The research, among other elements, focuses on after-sales service.
KEEPING YOUR EYE ON THE PERCENTAGE
All the scores in the various categories were calculated as percentages. Those percentages were then recalculated to reflect a percentage of the top finisher in that category. So if a vehicle recorded the best results in a segment, it achieved 100%. All the other vehicles’ results would then reflect a percentage of that winning score.
For instance: the Toyota Hilux recorded the best fuel consumption of 9.6 litres/100km, earning it that 100% score. The Mahindra Pik Up Karoo followed in a close second, achieving 9.67 litres/100km. The Mahindra’s result was reworked as a percentage of the Hilux’s segment-winning number, so 99.2%.
On the other end of the scale the Toyota Land Cruiser Namib recorded 19.98 litres/100km – for a final percentage of 48.2% in this segment.
We’ll be posting the write-ups on each bakkie from 10th place to first place as the week goes on, but for now, here are some of the results.
1 VW Amarok: 7.54 seconds
2 Mercedes-Benz X350d: 8.25 seconds
3 Mitsubishi Triton: 11.83 seconds
4 Ford Ranger Wildtrak: 12.13 seconds
5 Nissan Navara: 12.32 seconds
6 Isuzu D-Max: 12.78 seconds
7 Toyota Hilux: 13.11 seconds
8 Ford Ranger Raptor: 14.37 seconds
9 Mahindra Pik Up: 17.33 seconds
10 Toyota Land Cruiser: 20.66 seconds
PARTS BIN COMPARISON
1 Isuzu D-Max R62 578
2 Ford Ranger Wildtrak R72 078
3 Mahindra Pik Up R72 716
4 Toyota Hilux R78 534
5 Nissan Navara R84 122
6 Toyota Land Cruiser R126 341
7 Mercedes-Benz X350d R126 461
8 Ford Ranger Raptor R147 653
9 VW Amarok R153 994
10 Mitsubishi Triton R202 111
POWER TO WEIGHT
1 VW Amarok 70.69 kW/ton
2 Mercedes-Benz X350d 59.04 kW/ton
3 Nissan Navara 48.15 kW/ton
4 Mitsubishi Triton 44.98 kW/ton
5 Ford Ranger Wildtrak 44.55 kW/ton
6 Toyota Hilux 44.14 kW/ton
7 Isuzu D-Max 42.13 kW/ton
8 Ford Ranger Raptor 41.56 kW/ton
9 Mahindra Pik Up 39.64 kW/ton
10 Toyota Land Cruiser 37.64 kW/ton
BRAKING 100–0km/h (500kg LOAD)
1 Nissan Navara 42.19m
2 Mitsubishi Triton 42.90m
3 Toyota Hilux 42.97m
4 Isuzu D-Max 43.61m
5 Ford Ranger Wildtrak 43.86m
6 Mahindra Pik Up 43.89m
7 VW Amarok 44.24m
8 Mercedes-Benz X350d 44.30m
9 Ford Ranger Raptor 45.87m
10 Toyota Land Cruiser 69.56m
DOUBLE LANE CHANGE TEST (ISO 3888-1)
1 VW Amarok 4.13 seconds
2 Ford Ranger Raptor 4.21 seconds
3 Toyota Hilux 4.22 seconds
4 Ford Ranger Wildtrak 4.24 seconds
5 Nissan Navara 4.31 seconds
6 Mahindra Pik Up 4.37 seconds
7 Isuzu D-Max 4.39 seconds
8 Mitsubishi Triton 4.42 seconds
9 Mercedes-Benz X350d 4.56 seconds
10 Toyota Land Cruiser 4.85 seconds
Below you’ll also find all of the results as downloadable pdfs.
BOY 4×4 approach angle BOY 4×4 ground clearance BOY Final scores ALL BOY handling BOY judges results BOY parts bin details BOY Parts bin rating BOY power to weight ratio BOY Safety BOY Top Stats BOY Towing BOY weight carrying in-gear 500kg BOY weight carrying